Buffalo’s 6.4-mile LRT system, with 5.2 miles (81%) in subway, has not been expanded since its opening in 1985. The high cost of subway construction is a likely factor. Photo: Buffalo Tourism.
♦
Before the surface electric urban railway (the technology of former streetcar and interurban systems) was reborn as light rail transit (LRT) in the mid-1970s, North American urban areas that wanted urban rail for their inner cities really didn’t think there was any choice other than a full subway-elevated system — rail rapid transit, aka a metro system.
But not only was the expense of such a system daunting, and way above the financial capability of most moderate-sized and smaller American cities, its tremendous capacity generally wasn’t needed for cities just trying to get their feet wet with better-quality public transit.
Then, LRT as an option began to emerge, unveiled with maximum force at the first National Light Rail Conference of the Transportation Research Board (TRB) in 1975, and … ka-boom! Urban rail systems in the form of lower-cost LRT began to sprout up in city after city. And they’ve been widely hailed as a great success and model for good urban public transport.
But the “why not a subway?” issue keeps rearing its head — mainly reflecting the resistance of the motor-vehicle-focused mindset to having urban space, especially street space, shared or usurped by mass transit operations. Overwhelmingly, surface LRT in one type of alignment or another (from street reservations to the re-use of abandoned railway corridors) has triumphed … although there have been cases where pressure to “build it out of sight” has forced new LRT startups underground (or even canceled planned projects altogether).
The tremendous investment cost of digging a subway and installing underground stations is obviously a huge deterrent to the development of such systems — both in the initial financing, and in sopping up available resources that could otherwise be plowed into vigorous expansion of the system. Buffalo’s 6.4-mile LRT line, for example, was constructed almost entirely (81%) in subway … and hasn’t been expanded one foot since its original opening in 1985.
One should keep in mind that the cost of more modest local projects (such as wastewater tunnels or similar smaller tunnels) can be very deceptive. Rail transit subways involve far more complex features (after all, they must provide environments to enable large numbers of human beings to survive underground safely and comfortably). There must be ventilation and lighting, of course, and often air-conditioning. More significantly from a cost standpoint, underground stations are extremely expensive, including access (elevators and escalators designed to convey large volumes of passengers rapidly up and down). Access for trains to get from the surface into the subway can also be expensive, typically involving portals spanning up to two city blocks and lengthy underground approach ramps to and from the level main subway alignment.
Nevertheless, from one city to another, subway enthusiasts (or, often, anti-rail Road Warriors seeking to tie a subway albatross around the neck of local rail planning) continue to emerge from time to time claiming that subway construction would cost only “slightly more” (or sometimes, even, “no more”) than installing a new urban rail line in public streets.
So a solid fact check is in order. After considerable investigation, the study summarized here has gathered a selected assortment of recent urban rail projects (all from the 2000s), either completed or well under construction and fully budgeted. A major and very helpful source has been Comparative Subway Construction Costs, Revised from the Pedestrian Observations blog, including data cited in comments. Additional data has come from Tramways & Urban Transit magazine (hardcopy only), September 2013 through February 2014 issues, data in Light Rail Now, Wikipedia, and the research study Comparative examination of New Start light rail transit, light railway, and bus rapid transit services opened from 2000, co-authored by Lyndon Henry and Dave Dobbs, and presented in November 2012 to the 12th National Light Rail Transit Conference in Salt Lake City, sponsored by the TRB and American Public Transportation Association (APTA).
In this cost comparison, only full subway projects (entirely or nearly totally underground) are included. These also include LRT subways (e.g., San Francisco’s Central Subway, and underground LRT projects in Seattle). LRT projects are exclusively (or nearly so) in street alignments (e.g., San Francisco’s T-Line, Salt Lake City’s University line), and involve full-capability, high-performance LRT rather than streetcar technology. In some cases (e.g., Houston, Phoenix, Minneapolis), construction may include short segments on bridges or an exclusive alignment, but most construction is in-street. (LRT development is being aggressively pursued worldwide, and there are many more LRT projects recently constructed or now under way than are included here — but keep in mind that this study focuses only on projects with exclusive or nearly exclusive in-street construction (to compare the most difficult, highest-cost type of surface construction with subway construction). For most LRT projects, in-street construction may only represent a portion of the total alignment.)
All projects include costs of vehicles and facilities, as applicable. One should also note that the unit cost of an extension project is typically less than that of a new-start project, since basic storage-maintenance facilities and a vehicle fleet are often already in place, with perhaps only incremental additions required.
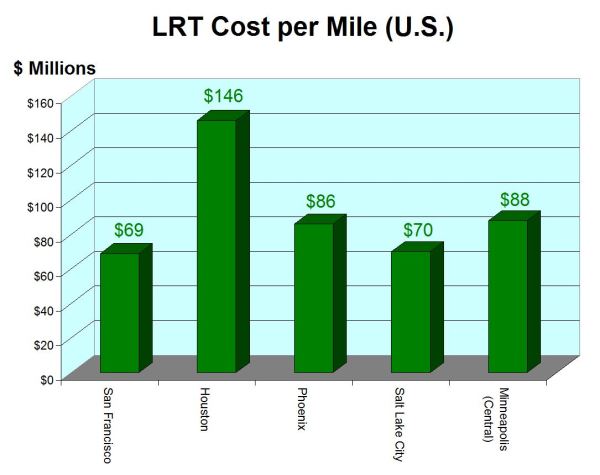
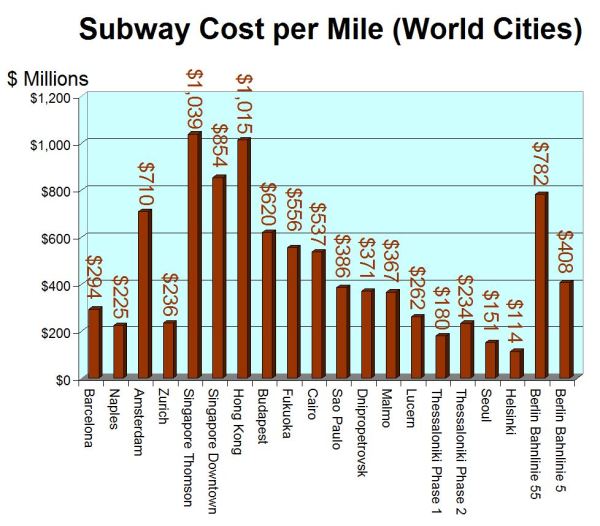
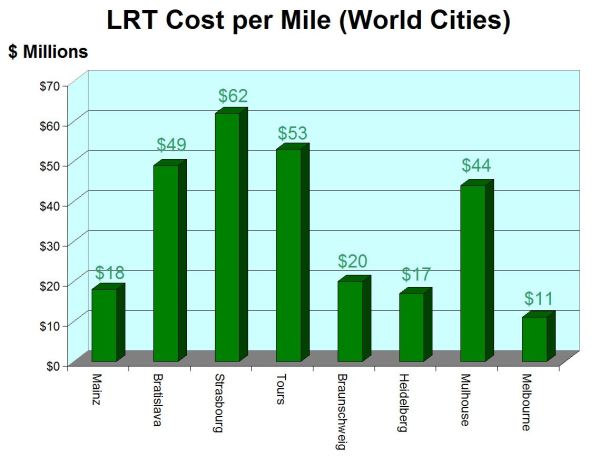
Per-mile unit costs (millions of U.S. dollars per route mile) have been calculated from total project costs and project lengths, and escalated to 2014 dollars. The results are presented in the following bar charts.
U.S. projects
Basic cost-per-mile data is present in this section for U.S. projects only ($ millions per mile).
Projects in other world cities
The cost-per-mile data in this section is derived from various projects outside the USA around the world (U.S. $ millions per mile).
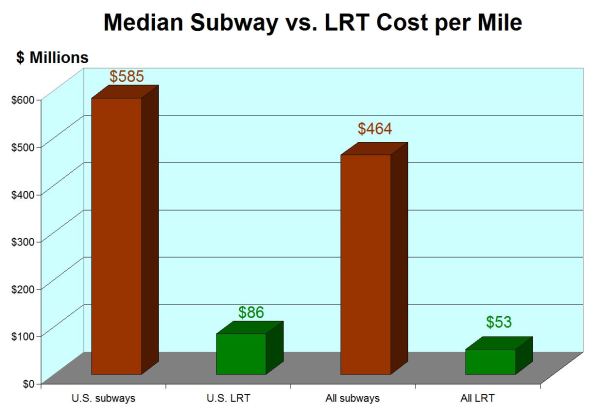
Conclusion — Subways cost many times more
This final graph compares median cost per mile between subway and in-street LRT projects for both the USA and for all projects (including U.S.) worldwide (U.S. $ millions per mile).
From this data visualization, it can be seen that, for recent U.S. projects, subway construction has a median cost nearly seven times that of in-street LRT construction. Worldwide, the differential is nearly 9:1. And thats only comparing in-street LRT construction, not accounting for the possibility of, say, transitioning into an available railway alignment outside the city center, with far lower installation cost.
What this means is that, even if your community can somehow afford the initial financial commitment (even with federal assistance), expansion of your system will be severely attenuated. Basically, for a given amount of available funding, you can construct 7 to 9 times as much surface LRT as subway. Put another way: For available resources, you can have a far more comprehensive rail system with surface LRT, many times the size of a system relying on subway construction.
That doesn’t mean there’s never an appropriate role for subway alignments. Both Portland and Dallas, for example, are now evaluating subway options through their CBDs to keep pace with ridership growth and the need for fast, more frequent service going beyond in-street capacity.
But both cities relied primarily on surface construction to start and develop their initial systems (although, because of special conditions, Dallas’s initial system did include a short stretch of tunnel under the North Central Expressway). In any case, any community considering a new urban rail system should pause and take a deep breath, with an eye on the longer-term implications, before committing to a subway option. And certainly, from the data above, such a commitment should not be made on the supposition that a subway would cost “just a little bit more” than constructing LRT in the street.


Pingback: Subway cost per mile nearly 9 times higher than for light rail, says study | _______________Austin Rail Now
LRT does ABSOLUTLEY NOTHING to alleviate Surface Congestion.
In fact, most cities took their LRT systems OUT in the first place!
Come to South Korea and see what a REAL transit system looks like!!!!!
LikeLike
It takes some of the people out of their cars.
LikeLike
South Korea is one of the most densely populated countries in the world. That would necessitate high-capacity, clear-guideway transit (which subway is). The US has a slightly different situation. In Dallas, for example, there’s more of a need for an interurban-style system as the city is a essentially a large, sprawling collection of neighborhoods with highly variable density. Comparing Seoul to the DFW area, DFW has roughly half the people of Seoul city in six times the area.
Besides, in an area like Seoul, for every person who moves out of a car into a train, three more move into town with a car. There’s no real solution to congestion in Seoul except for Kim Jong-un to arrive uninvited with a million or more of his goons. A Northern invasion might clear that place out pretty fast. In Dallas, I’ll bet a dime against a hole in a doughnut that every day there’s several people who forego a car trip for rail, especially with a connection to both airports (Love Field by shuttle bus, DFW directly). Considering the massive web of highways and arterial roads in the Dallas area, I don’t think there are going to be any trips enabled by rail that don’t replace a car trip, and by that mathematics alone DART Rail reduces congestion. Whether it does by enough to justify the expense is another question, but I will say that my own most recent trip went tolerably well even though I didn’t rent a car, because all my destinations were close to the rail system, so there’s at least one car that didn’t go on the road that could have.
LikeLike
LRT exist well in moderate populated cities who’s traffic problems are moderate. However, heavy traffic can clough a lightrail line unless it is grade seperated. Grade seperation can take lanes that was once ment for gas venicles, which can result in traffic congestion. This in some ways defeats the initial purpose. An alternative would be to re-route the line to a former line (Northern NJ Lightrail is an example). But the likelihood of a former rail line existing in the CBD is a shot in the dark. Many trainsit systems like that have been removed many decades ago because of traffic concerns. Some cities have opt to connecting bus lines to the lightrail station so passengers needed to go to the CBD can use it. Buses offer the most flexible option of the two (LRT and Subway). However, you can’t grow a city with buses.
Subways can be buit cheaper by placing stations further apart. LRT can compliment the Subway by offering more stops. Buses and Streetcars can compliment LRT by operating in tightly grided streets.
I like Streetcars because you don’t need stations for them and generally smaller. Smaller means that other vehicles can get around them. And buses for it flexibility in routing.
LikeLike
Your thesis is misleading. It does cost less to construct an LRT system, but you recover more revenue with a subway through fare certainty and volume. In Portland, only 40% of the riders actually pay anything and it’s faster to ride a bike downtown than to sit and wait for the MAX and it’s traffic lights. The fines for freeloading are $400 and predominately hit low income and minority populations. Finally, 4% of the Portland Metro area population uses MAX while 28% of NYC uses the subway.
LikeLike