

Left: Phoenix LRT in arterial alignment. Right: Houston LRT in street alignment. Photos: L. Henry.
♦
Increasingly, interest has been growing in the use of street and arterial roadway rights-of-way (ROW) as alignments for new light rail transit (LRT) segments – either new-start systems or extensions to existing systems. As planners, other professionals, advocates, and civic leaders consider such projects, it’s useful to have reliable data on the installation costs.
Unfortunately, many available “average unit cost” methodologies present averages based on various types of alignment — such as re-purposed railroad ROW – rather than exclusively or predominantly street/arterial corridors, which present quite specific needs, challenges, and costs with respect to installation of LRT. For example, while railroad ROWs typically need rehabilitation, much of the necessary preparation for LRT tracklaying is usually in place; space and installations costs for overhead contact system (OCS) infrastructure and stations are often easier to deal with. On the other hand, installing LRT tracks, stations, and electrical systems in streets/arterials typically requires extra (and more costly) tasks such as pavement removal, subsurface utilities relocation, traffic management and reconfiguration, and other measures.
The brief study described in this post has been undertaken as an effort toward fulfilling the need for reliable total-system unit cost data for street/arterial LRT project installations. It has focused on predominantly (or exclusively) street/arterial LRT projects, drawing upon data from eight specific projects in five U.S. cities (Salt Lake City, Houston, Portland, Phoenix, and Minneapolis) as listed in the table further below.
Also, this study (conducted by LRN technical consultant Lyndon Henry) has endeavored to avoid carelessness as to what is designated as “light rail”. As it has been most pervasively considered since the 1970s, LRT is regarded to be an electrically powered mode, not a light diesel-powered regional railway. For the purposes of this study, LRT has been considered as both electrically powered and operating predominantly in exclusive or reserved alignments (i.e., streetcar-type systems have been excluded).
Analysis of this data has yielded an average capital cost of $85.5 million per mile ($53.0 million per kilometer) for construction in these kinds of alignments. This figure might be considered appropriate for approximating system-level planning cost estimates for corridors considered possible candidates for LRT new starts or extensions. (Capital costs, of course, may vary significantly from corridor to corridor depending on specific conditions, infrastructure needs, service targets, and other factors.)
It should be noted that these data have been primarily drawn from Federal Transit Administration resources (particularly New Start profile reports), supplemented where necessary by data from Light Rail Now and Wikipedia. Because these figures present final total capital cost data, they represent final year-of-expenditure costs, including infrastructure and vehicle requirements, and incorporate other typical ancillary cost items such as administration, engineering, contingencies, etc.
Capital costs for the eight projects were tabulated as shown in the table below.

Relevant data for 8 LRT segments used in study. (Click to enlarge.)
NOTES
Portland: Interstate (Yellow) line data include section at outer (northern) end on viaduct over Columbia Slough and flood plain. Phoenix: Initial project data include new LRT bridge over Salt River, and short section on abandoned Creamery Branch of Southern Pacific Railroad. Minneapolis: Green line data include adaptation of roadway bridge over Mississippi River.
It should also be recognized that the design requirements and installation costs of streetcar-type LRT projects average significantly lower than those of rapid or interurban-type LRT, particularly because of several factors. For example, streetcar alignments predominantly share street/arterial lanes with existing motor vehicle traffic. Stations often consist of simple “bulge-outs” from adjacent sidewalks, and are typically designed for single-car trains (i.e., single vehicles) rather than multi-car LRT trains. Also, the lighter static and dynamic loading requirements of some streetcar configurations facilitate the use of lower-cost “shallow slab” construction rather than the deeper excavation more typical of “heavier” LRT designs.
Capital costs and line lengths were aggregated for all eight LRT cases studied. Results are presented in the table below:
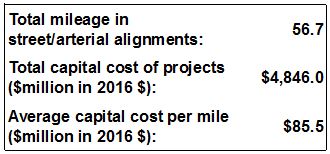
Data and calculation of average LRT project cost in street/arterial alignments.
Hopefully, the information from this study will be helpful in developing realistic cost estimates for new LRT projects in these types of alignments. ■


